
Note: Kendrick Kho contributed heavily to the modeling in this post
There are a few examples of funds building very large portfolios of early stage companies, mainly being YC, 500 Startups, SV Angel and to some extent A16Z. The reasons for building a larger portfolio vary between funds (since they have different incentives) but common among all of them is the benefit of a higher likelihood of having a hyper-successful company in the portfolio. The trade-off however (assuming that the fund dollar amount if constant) the ownership per portfolio company will be lower (assuming that the post-money valuations are steady also.) So is the benefit of higher likelihood of hyper-successful portfolio company worth the lower ownership per portfolio company?
Given the Power Law sensitivity in VC (the Nassim Nicholas Taleb famously called the Black Swan effect) to the point where one Airbnb is (currently) worth roughly 30 'regular' unicorns [1]). But what we can do is build a higher level abstraction of what happens with a larger portfolio, shown below.
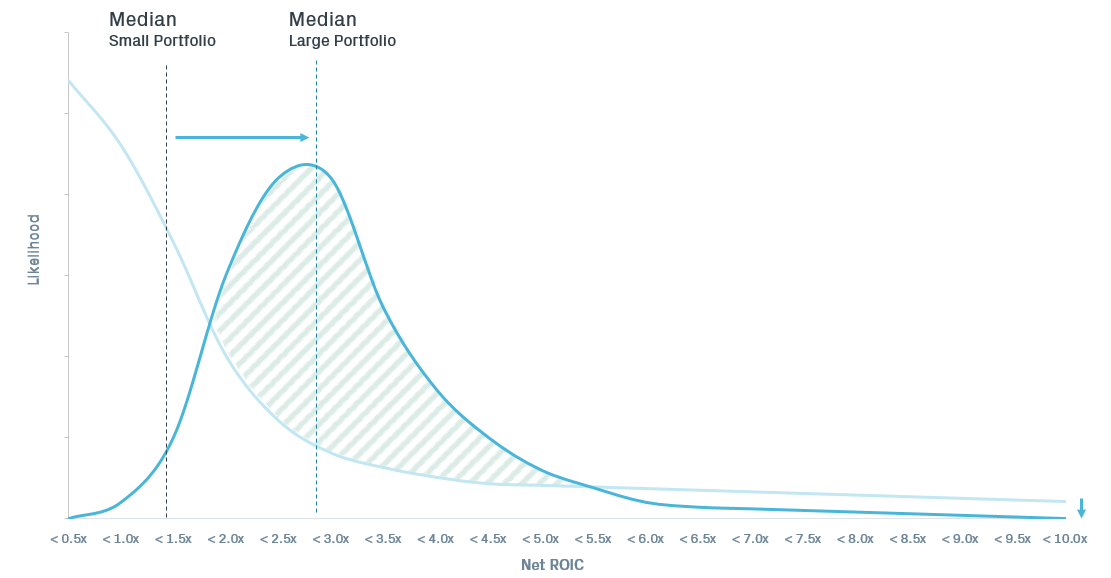
Effectively what we are doing is moving from the light blue line (high likelihood of low return, but very small likelihood of extremely high return - far right) to that of the dark blue line (high likelihood of 'decent' return but lower likelihood of extremely high return - far right.)
This is because the small portfolio (say 20 - 30 companies) is concentrated and there will be some simulations where Airbnb (or equivalent) is in this concentrated portfolio which will lead to extremely high returns. In the larger portfolio, most of the simulations will exhibit a hyper-success company but we have lower ownership and therefore this hyper-success company doesn't contribute 10x the fund but maybe 1.5x. But this happens a lot more than in the smaller portfolio since now we are very diversified.
The above is merely meant to represent the idea of portfolio diversity and concentration. We now have simulated these two scenarios using the Power Law Hybrid outlined in a previous post. Results of this (1,000 trial Monte Carlo simulation) are shown below.
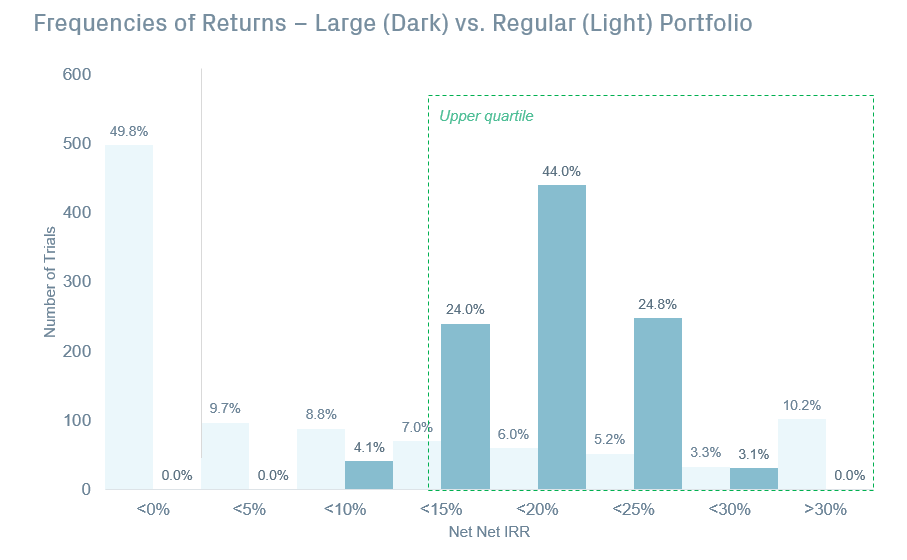
Here we see (in a bit more detail) the effect described above. Almost 50% of the time, our smaller portfolio (light blue) loses money (negative IRR). But, 10% of the time we return >30% IRR. Compare this with the larger portfolio (dark blue). Here we see (almost) 0% chance of returning <0% IRR (graph rounds very small numbers to 0%) but also (almost) 0% chance of returning >30%. Herein lies the tradeoff.
The larger portfolio is more reliable in returning an IRR of 15%+ but we miss the chance of returning 30%+. For LPs in many cases they can deploy funds that reliably generate 15% in different asset classes. They choose early stage venture specifically for the extreme and out-sized returns (despite this occurring only 10% of the time - in this simulation.)
So now we can look at estimating how many portfolio companies are required to build a 'diversified' early stage portfolio. The graph below holds the fund $ size constant and adjusts the ownership per portfolio company along the x-axis representing the number of companies in our portfolio. The dark blue line is the median expected ROIC of the portfolio (again over a 1,000 trial Monte Carlo simulation) and the shaded blue represents the 3rd and 1st quartile. From the graph we can see that at around 250 - 300 companies the benefits of diversification are realized (disclaimer: this simulation is highly stylized and for discussion purposes only.)

[1] http://graphics.wsj.com/billion-dollar-club/