
Investors in early stage private technology companies produce a very rich graph to investigate. The graph is a secondary result of the investment activity (no one focuses on the graph while they invest). In this regard it is more like 'data exhaust'.
But the information is very valuable since it allows you to quantify the 'connectedness' of an individual, or their centrality. There are many different forms of centrality (eigenvector centrality, betweenness centrality etc.) that are appropriate depending on the context of the problem.
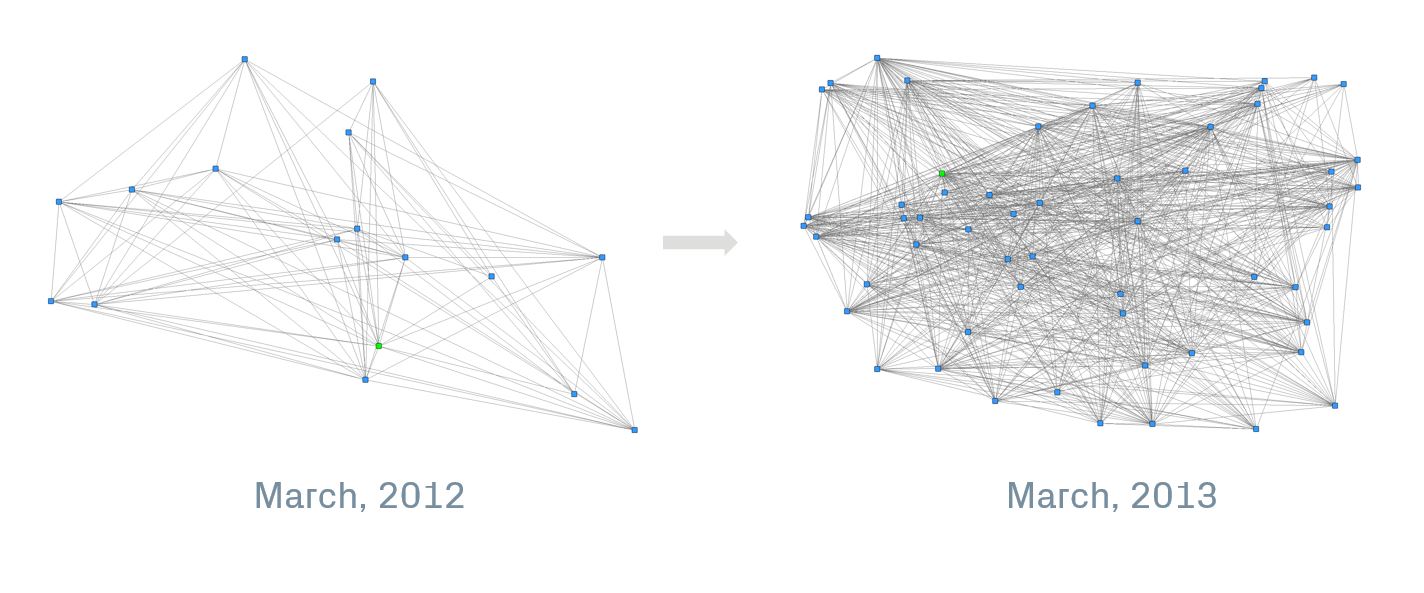
In investigating emerging early stage investors, one could look at the 'ego network' of the investor in question at two points in time (after 2 or 3 deals and then again a year later, assuming they've executed more deals in that time). Using open source software from Stanford [1], you can quantify the difference in that investor's centrality. In an environment where access via relationships is important (as in early stage tech investing) this quantification of an investors increase in centrality could be very valuable as a proxy for their future success.
[1] https://sites.google.com/site/ucinetsoftware/home